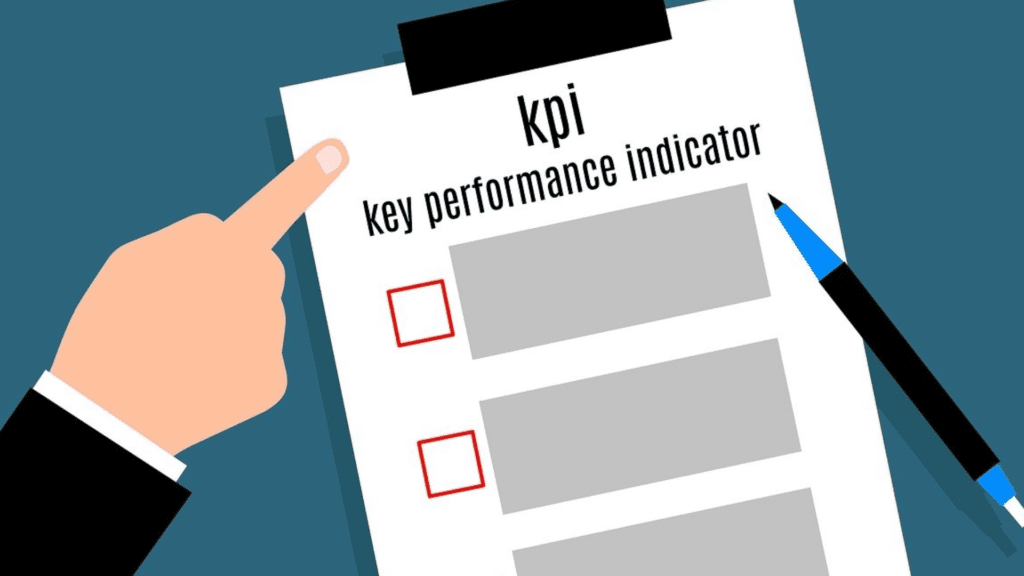
Why you need Maintenance Analysis Dashboards.
There is no limit to how many measures we can create to look at each week/month/year, but unless these measures are set up in your CMMS to produce automatically, the amount of time and money spent producing your measures may be considered wasteful.
Creating a one-stop-shop dashboard for everyone to access information is a great idea, but if you report on too many topics, it can become overwhelming. It may be a better idea to create role-based dashboards. A daily/weekly snapshot of role-based metrics can then be emailed to all employees in that group.
Many organizations still rely on individuals spending vast amounts of hours collecting and tabling performance results each week. While this approach may have worked in the past, it is not the most effective or efficient method in today’s fast-paced business environment. Here are some of the drawbacks of manual data collection:
1. It’s so very time consuming: Collecting and tabling performance results manually can be a time-consuming process. Employees must spend hours each week gathering data from various sources, inputting it into spreadsheets, and analysing the results. This not only takes away valuable time from other critical tasks but also increases the risk of human error.
2. It’s done manually on spreadsheets, so it’ probably prone to errors: Manual data collection is inherently prone to errors. Even the most diligent employees can make mistakes, whether it’s through data entry errors or miscalculations. These errors can have significant consequences, leading to inaccurate analysis and decision-making.
3. Lack of real-time insights: In today’s fast-paced business environment, real-time insights are essential for effective decision-making. However, manual data collection and analysis processes often result in delayed insights. By the time the data is collected, analysed and tabulated, it may already be outdated, making it challenging to respond promptly to maintenance issues or identify areas for improvement.
The Benefits of Automated CMMS Data Analysis Dashboards.
Fortunately, there is a more efficient and effective alternative: automated CMMS data analysis dashboards. These dashboards use technology to streamline the data collection and analysis process, providing organisations with real-time insights and a variety of other benefits such as:
Automated CMMS data analysis dashboards eliminate the need for manual data collection and tabulation. Instead of spending hours gathering and inputting data, employees can focus on more value-added tasks. The dashboards automatically collect and consolidate data from various sources, saving valuable time and reducing the risk of human error. Below are just a few advantages of going down this path:
a) Accurate analysis: By removing the human element from the data collection process, automated CMMS data analysis dashboards minimize the risk of errors. The dashboards use algorithms and predefined metrics to analyse the data, ensuring accurate and consistent results. This enables organizations to make informed decisions based on reliable data.
b) Real-time insights: One of the most significant advantages of automated CMMS data analysis dashboards is the ability to provide real-time insights. The dashboards continuously update with the latest data, allowing organizations to monitor maintenance performance in real-time. This enables prompt identification of issues, proactive maintenance planning, and the ability to make data-driven decisions on the spot.
c) Customisable and interactive: Automated CMMS data analysis dashboards offer a high level of customisation and interactivity. Organizations can tailor the dashboards to their specific needs, choosing the key performance indicators (KPIs) and metrics that matter most to them. Users can also interact with the dashboards, drilling down into the data and exploring trends and patterns to gain deeper insights.
d) Enhanced collaboration: Automated CMMS data analysis dashboards promote collaboration within the organization. Instead of relying on individuals to manually share reports and findings, the dashboards provide a centralized platform for teams to access and discuss the data. This fosters better communication, alignment, and collective decision-making.
As businesses expand, so does the demand for increased efficiency and effectiveness in maintenance management. The more moving parts there are in something, combined with the more people who operate and maintain them, the more variables can creep in and catch you off guard. As we all know, surprises are one of the things that maintenance departments despise.
Automated CMMS data analysis dashboards are a better alternative to manual data collection and tabulation. These dashboards save time, ensure accurate analysis, provide real-time insights, promote collaboration, and provide you with what you need to know right when you need it. Using automated CMMS data analysis dashboards allows organisations to make data-driven decisions and improve maintenance performance for long-term success.
Below are 36 worthwhile Maintenance/Asset Effectiveness Measures for you to consider adopting with your Dashboards:
1. Asset Integrity: The Utilised Time /Utilised Time + Breakdown Losses as a %.
2. Availability – Available Time /Calendar Time as a %.
3. Reliability (MTBF)- Mean Time Between Failures (breakdowns/emergency work) in hours.
4. Maintainability (MTTR) – Mean Time To Repair in hours.
5. Breakdown Maintenance Ratio – Breakdown Down Time/Total Downtime as a %.
6. Planned Maintenance Ratio – Planned Down Time/Total Downtime as a %.
7. Maintenance Labour Ratio – Gross Maintenance Personnel hours/Utilised Hours as a %.
8. Overtime – Overtime Hours/Total Hours as a %.
9. Predictive and Preventive Maintenance Labour – Preventive + Predictive Labour Hours/Total Hours as a %.
10. Breakdowns Labour Hours – Breakdown Labour Hours / Total Labour Hours as a %.
11. Scheduled Maintenance Effectiveness – Schedule Overruns/Scheduled Time as a %.
12. Maintenance Productivity – Total Hours time confirmed/Total Hours Worked as a %.
13. Total Maintenance Costs – Total Maintenance Costs per week, month, quater, cal/fin year $.
14. Unit/Asset Costs – Total Maintenance Costs/SMU/ either (Meter hours/Utilised Hours/Kms travelled/Tonnes dispatched as $ / Hr/Kms/Tonnes.
15. Breakdown Cost Ratio – Breakdown Costs/Total Maintenance Costs as $/Hr.
16. Contractor Costs Ratio – Contractor Costs/Total Maintenance Costs as a %.
17. Accident Damage – Accident Damage Costs $ – you may have forecasted a small % of your total costs could related to accident damage.
18. If you have the mechanism within your CMMS – try to single out any Rework costs ever month and report on those as a % of total maintenance costs.
19. Report on any Work order costs carried out that are subject to Warranty claims as well as the age of these work orders/claims – this will trigger following up with claims.
20. Schedule loading – % of net hours available committed to scheduled work order operations/tasks/activities for the upcoming schedule week.
21. Planning Accuracy %.
22. Scheduled Work Ratio %.
23. Work Distribution (Primary, Secondary & Breakdown) %.
24. Maintenance Strategy Work Orders – Monitor the average amount of elapsed days from Work Order Creations to Completion.
25. Maintenance Strategy Work Orders – Monitor variances between Planned and Actual Work Order Costs and relate those costs back to the total costs associated with the Task List that was the foundation of those work orders.
26. Report on any instances of Zero Actual Work order costs where there was planned costs (looking for instances of people not actually doing the strategy work).
27. Report on any instances of Maintenance Strategy work orders printed if using hardcopies or not accessed via portable devices (looking for instances of people not actually doing the strategy work).
28. If using SAP, record no of Instances of suspected ‘Do Not Executing’ Maintenance Strategy Work Orders.
29. Monitor Instances of ‘No Time Confirmations’ Maintenance Strategy Work Orders (is it because people forgot or is it that the work is not being done?).
30. Task List/Standard job Activity Hours Versus Maintenance Strategy Work Order Activity Hours.
31. Task List/Standard job Activity Descriptions Versus Maintenance Strategy Work Order Activity Descriptions.
32. Task List/Standard job Activity Materials Versus Maintenance Strategy Work Order Activity Materials.
33. Parts usage on Maintenance Strategy Work Orders per month (Planned vs. Actual).
34. Report on the number of ‘Follow Up’ Work Requests/Notifications created from or in reference to Maintenance Strategy Work Orders.
35. Maintenance Strategy task lists/standard jobs changed for Period or requested to be changed (were the changes approved?).
36. Report on what they types of Maintenance Strategies that are being used? Time or Performance Based – % spread.
What to do if your CMMS can’t be configured to provide you with a holistic reporting Dashboard?
If your CMMS lacks the capability to provide you with an automated dashboard, there’s no need to worry.
You can seamlessly integrate a software product like Corvu Business Intelligence to enhance your CMMS and gain all of the valuable insights you need.
Seamless Integration with Corvu Business Intelligence.
Corvu Business Intelligence is a powerful software product that specializes in transforming data into actionable insights. It seamlessly integrates with various CMMS systems, including those without built-in dashboard capabilities. By integrating Corvu with your CMMS, you can unlock a wide range of benefits:
Enhanced Data Visualization: Corvu Business Intelligence offers advanced data visualization tools that allow you to create interactive dashboards, charts, and graphs. These visual representations make it easier to interpret complex maintenance data and identify trends or patterns at a glance. With customisable dashboards, you can choose the KPIs that matter most to your organization and monitor them in real-time.
Comprehensive Reporting: With Corvu, you can generate comprehensive reports that provide in-depth insights into your maintenance operations. These reports can be customized to include various metrics, such as work order completion rates, asset performance, and maintenance costs. By having access to detailed reports, you can identify areas for improvement, optimise maintenance schedules, and allocate resources effectively.
Predictive Maintenance Capabilities: Corvu Business Intelligence goes beyond traditional maintenance management by offering predictive maintenance capabilities. By analysing historical data and identifying patterns, the software can help you predict equipment failures and schedule maintenance proactively. This proactive approach reduces unplanned downtime, extends asset lifespan, and improves overall operational efficiency.
Conclusion.
While an automated dashboard may not be a built-in feature of your current CMMS, you have the option to seamlessly integrate Corvu Business Intelligence software. By doing so, you can enhance your CMMS with advanced data visualization, comprehensive reporting, and predictive maintenance capabilities. With Corvu, you’ll have the tools you need to make data-driven decisions, optimise maintenance tasks, and improve overall asset performance.
Investing in Corvu Business Intelligence is a strategic decision that allows you to maximize the value of your CMMS and take your maintenance management to the next level.


[…] Maintenance Analysis Dashboards – CMMS SUCCESS. Safety and Maintenance Interconnection – CMMS SUCCESS. Effective Risk Management at Work – CMMS SUCCESS. Asset Management Framework – CMMS SUCCESS. Asset Management Framework. CMMS Success Training Room. Discover the Power of Asset Management with CMMS Success. Generic Equipment Servicing Information – CMMS SUCCESS. Insurance for CMMS software development companies. Cyber Security for CMMS Software Development Companies. Asset Management Training for Planners – CMMS SUCCESS. Your boss needs solutions not problems – CMMS SUCCESS. […]
[…] With real-time dashboards and reports, organizations can gain insights into key performance indicators, identify trends, and […]
[…] effective approach is the utilization of asset management analysis dashboards. These tools allow real-time tracking and analysis of key performance indicators (KPIs) and provide […]
[…] system users can generate reports, queries, or other compliance-related data using standardised maintenance dashboard functions, virtually any maintenance department employee can produce highly important information for […]
[…] where maintenance analysis dashboards come […]