Analysing Maintenance Performance

Analyse Maintenance Performance

Using Leading & Lagging metrics when analysing Maintenance Performance

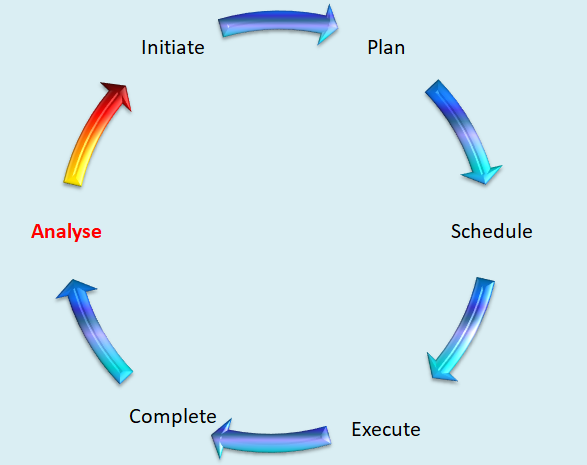
Your maintenance process’s performance must be measured and reviewed, and any chances for improvement must be pursued. Evidence that measurements are examined at regular meetings and results are managed to completion should be presented.

maintenance performance

Leading Metrics

These metrics look at the effort you are putting in to improve your organisation and will indicate that some changes may be visible before they occur.
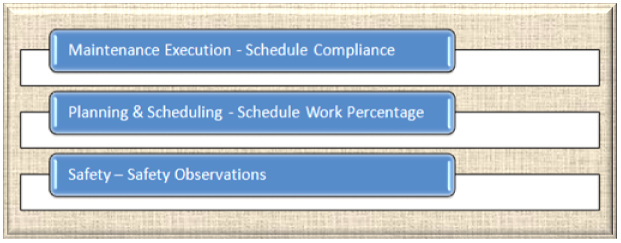
Leading Indicators

Schedule Compliance

Schedule compliance is an incredibly effective lead metric.

If your schedule compliance percentage is low, some causes may be:

  1. Scheduled work is not being completed due to an increase in the amount of emergency or breakdown work orders taking priority and hijacking the maintenance team’s efforts.  
  2. Your company is yet to become proactive in its maintenance approach and is still very much in a reactive state.
  3. Too much scheduled work is being approved, highlighting inefficiency in scheduling meetings.   This could involve a large number of unneeded and excessively frequent preventive maintenance jobs; maintainers should provide feedback to supervisors on these occurrences.
  4. Your equipment reliability is starting to drop away
  5. You may have had a high turnover of personnel in recent times, a large number of new employees who are still learning your equipment, and you may have relied extensively on contractors to replace unfilled positions on an as-needed basis.
  6. It’s also conceivable that you’re not gaining enough knowledge from your breakdown work. Although maintenance teams dislike having to respond to urgent failures at all hours of the day and night, it’s critical that you employ problem-solving skills to fully understand what’s going on and use this information to strengthen your preventative maintenance efforts. Consider using a tool like ‘Why Why Analysis.’

Safety Observations

safety observation

When safety observations are conducted on a regular basis, it helps to foster an interdependent safety culture and an environment in which people believe they can speak freely and be heard often. They provide an opportunity for maintainers to connect with the leadership team, and the key to excellent safety observations, like with any other sort of human interaction, is mutual concessions/compromise; a little back and forth works great.

Those doing safety observations should keep in mind that they only have two ears and one mouth, therefore they should listen twice as much as they talk. Listen to what others are saying if you want the observation to be a positive experience for everyone involved. Active listening skills will reveal bits and pieces of knowledge that you can utilise to continuously improve safety and you might be surprised at how much you will learn.

LAGGING METRICS

These metrics show the outcomes of what’s been happening in your company and will record your actual performance after the events have happened.

Lagging Indicators

Lagging indicators are always prompted by recent events and as such are a little more self-explanatory than leading indicators.

Lagging indicators work best when combined with leading indicators to evaluate trends and whether or not outcomes were met.

With the right technology and regular review sessions that evaluate leading and lagging signs, continuous improvement is possible.

Understanding SChedule work

70% is a worthwhile initial target for Schedule Work Percentage.

The goal of the ‘Scheduled Work Percentage’ metric is to fully understand where all your maintenance departments work hours are actually being executed as apposed to where you wanted them to be executed.   For this metric to be effective, you need to make sure all contractor work hours are being entered on work orders.     It’s possible that a lot of your contractors won’t have CMMS access, so you will have to develop a workaround solution to make sure these hours are recorded.

Examples of a workaround solution are:

·         Your staff will need to Manually enter contractor actual hours against work orders

·         Develop a ‘Contractor Portal’ where their parent company can enter the required information into a software product that is interfaced with your CMMS and populates the actual hour’s data.

·         Give all contractors a ‘special’ level of access to your CMMS

Tip:

I recommend that you allow contractors to be able to enter comments against hour entry data, for instance, if a job has required 50% more hours than planned/scheduled, then a comment from the actual contractor that did the work would be of very high value.

How is the Schedule Work Percentage calculated?

Schedule Work Percentage = Actual Hours Recorded on Work Orders coded as ‘Scheduled’ divided by the Actual Hours Recorded on all Work Orders.

Review Scenario 1:   Your Scheduled Work Ratio was low for the last period and your schedule compliance was low.

This may indicate that scheduled work is being neglected and emergency and other high priority unplanned work is being done instead.

Review Scenario 2:   Your Scheduled Work Ratio was good but you notice that your schedule compliance is low

This tends to indicate that you’ve been able to execute the work on the schedule but you have experience a large amount of equipment/component failures.    This scenario should prompt investigation by your reliability team.   You may be on the verge of experiencing more equipment reliability issues.     This should prompt reviews of the maintenance strategies associated with the equipment that failed during this period, it’s possible that you’re not doing enough of the right type of proactive tasks.

There is also a chance that this scenario is a result of people partially processing completed work, they’ve entered their actual hours against the work order numbers but have not updated the status of the work order to ‘Complete’.

Here are a few tips relating to ‘Scheduled Work Percentage’

1.     Don’t overload your workforce with Scheduled Work; while doing nothing but ‘Scheduled Work’ could be described as a ‘Maintenance Utopia,’ there are probably only a few scenarios on this planet where that may be practical.

2.    Don’t deliberately load a smaller than normal/expected percentage of scheduled work into the forthcoming execution period just because you want to make your next schedule compliance percentage looks a bit better.    A big chunk of your scheduled work is going to be tasks that are approved outputs of your maintenance strategy, not doing these tasks will put at risk of unplanned failures.

3.    Be sure to conduct ‘5 Whys Analysis’ on as many of the emergency/breakdown work orders that occurred during the execution period as possible.   What you learn from this analysis will help you produce more effective schedules in the future and increase your equipment reliability.

4.    Set up a daily query within your CMMS to show what work orders have had actual hours entered against them and what the relating completion status is.   The Maintenance Supervisor should be able to indicate if those tasks are actually complete or not.

Automotive blog for CMMS users
0 0 votes
Article Rating
Subscribe
Notify of
guest
0 Comments
Inline Feedbacks
View all comments
0
Would love your thoughts, please comment.x
()
x
Scroll to Top